% tar -jx < *.bz
Bienvenue sur mon petit coin d'Internet. J'y poste quelques trucs plus (ou parfois moins) utiles, concernant mes geekeries.
Notes, penses-bêtes et divagations
TIL: Debian's apt-get satisfy
Écrit le vendredi 8 novembre 2024.
Debian's APT accepts the syntax apt-get install 'some-package=1.32' to
install an exact version of a package. TIL about apt-get satisfy, which lets
you ask for a version range, as in:
apt-get satisfy 'some-package (>=1.30)'
I found it useful for a CI script fragment where I don't care if the executor
runs Debian or Ubuntu, I only want to ensure that I'm using a recent enough
version of some-package.
The syntax is the same as in the Depends: field of a control file. You
pretty much have to use quotes to avoid the shell interpreting brackets or
redirection characters. Several packages are separated with commas, as in
apt-get satisfy 'foo (>=1.8), bar (> 2.3)'.
Remember to use apt-get in scripts, apt comes with the following note:
The
apt(8)commandline is designed as an end-user tool and it may change behavior between versions. While it tries not to break backward compatibility this is not guaranteed either if a change seems beneficial for interactive use.All features of
apt(8)are available in dedicated APT tools likeapt-get(8)andapt-cache(8)as well.apt(8)just changes the default value of some options (seeapt.conf(5)and specifically the Binary scope). So you should prefer using these commands (potentially with some additional options enabled) in your scripts as they keep backward compatibility as much as possible.
Keyboard layout: GB layout with dead keys on Linux, macOS, Windows
Écrit le dimanche 3 novembre 2024.
I'm using a UK keyboard layout with dead keys to access accents. The inspiration
is James Campbell's UK International keyboard, but I deviated a little bit, eg.:
AltGr+o becomes œ, AltGr+a is æ, this makes typing « mon cœur » and "UNIX©
dæmon" easier.
In xkeyboard-config's default layouts, the "English (UK)" layout puts the grave
on the # hash sign and the circumflex on the @ key, which is a choice I
don't like. The "English (UK, intl., with dead keys)" layout puts the dead keys
on more sensible positions eg. grave on the ` key, but the dead keys are the
primary keys, without an AltGr, which I find annoying. Hence making my own
layout, this is the final result.
Linux with X11
Install uk-intl.xkb somewhere in $HOME. Arrange to run xkbcomp uk-intl.xkb
$DISPLAY on session startup.
This includes a remapping of Caps Lock to be a second control.
Linux with Wayland
At some point, this stopped working when I moved to a desktop that uses Wayland
only, without X11. It appears that changes to input handling means xkbcomp
can't change the display's server layout, or something. Peter Hutterer wrote a
series of posts: User-specific XKB configuration, describing how to allow local
user configuration to augment the system's built-in layouts in the new world of
Wayland. libxkbcommon's documentation has much the same information.
In essence, we're defining a new gb variant that only has the changes from the
base layout. Extract xkb.tar.gz in $XDG_CONFIG_HOME (so that the variant file
ends up as ~/.config/xkb/symbols/gb). Log out / back in, then select the new
variant: under GNOME, go in the "Settings" tools, "Keyboard" page, in "Input
Sources" the little "+", "Add an Input Source" for "English (United Kingdom)",
and find "English (French accents on dead keys)".
While we're at it, C-. starts IBus emoji typing, to disable that:
gsettings set org.freedesktop.ibus.panel.emoji hotkey "[]"
Under KDE, to activate the new keyboard, go to "System settings", "Input & Output", "Keyboard", "Layout": "Add…".
macOS
Download and install UK Intl mk7. This can be edited with Ukulele. I started
from the GB keyboard layout and added a small number of dead keys. As a result
there may be other key combos that are different from Linux' layout above, for
characters I don't use (or not often). The mark "mk7" is because any
modification requires a new name, and that's how many attempts it took me to be
happy. I remember issues with the ` key being confused with the \ key, but I
don't remember if that was fixed by changing the layout definition or changing
an option in macOS' menus.
See also Change the behavior of the modifier keys to make Caps Lock another Control.
I also have the following to avoid unfortunate keyboard shortcuts:
- iTerm2
iTerm2 has a number of annoying shortcuts that conflict with standard key combos from readline eg.
C-wto close a tab. The following will disable those. Each option to the left of the=sign is an entry from a menu, to the right is a unicode char. U+200B is "zero-width space", something we can't hit by accident.defaults write com.googlecode.iterm2 NSUserKeyEquivalents '{ "Split Horizontally with Current Profile"="\U200B"; "Split Vertically with Current Profile"="\U200B"; "Split Horizontally..."="\U200B"; "Split Vertically..."="\U200B"; "Close"="\U200B"; "Close Terminal Window"="\U200B"; "Close All Panes in Tab"="\U200B"; "Minimize"="\U200B"; "Reset"="\U200B"; }'
- Outlook
The default
Cmd+Vresults in messed up fonts. Ideally it'd be replaced with a "paste" command that keeps text only, but I couldn't find this in the menus, so "match style" is the least worst option.defaults write com.microsoft.Outlook NSUserKeyEquivalents '{ "Paste"="\U200B"; "Paste and Match Style"="@v"; }'
The
@prefix is Cmd,^would be Control,~for Option,$for Shift.
Windows 10
Get ukint20s-FP.zip, which contains a binary file (a .msi) that requires
administrative rights to install then a reboot. This works on Windows 10 at
least, and worked on the last version of Windows that $WORK forced me to use
before that.
The source file is a .klc text file, which can be edited with Microsoft
Keyboard Layout Creator and then compiled the .msi which can be installed.
MKLC requires .Net Framework, which needs twiddling in the settings to install
and make available.
In order to remap Caps Lock to Ctrl, use ctrl2cap (this is a sysinternal tool by Microsoft; it requires admin access for installation, and a reboot after).
TIL: The TTYPath= setting to starting an interactive program on boot
Écrit le dimanche 27 octobre 2024.
For $WORK I had to setup a Linux machine (a Raspberry Pi) so that right
after boot, an interactive CLI tool would start, ready to receive input and
show information.
Of course if you start a script at boot, its stdin is closed and stdout
goes to the Journal. There exists openvt(1) to launch that script in a new VT
(or to take over tty1). (But then you have to mind that openvt needs to
run as root to open a new VT, so it should wrap sudo to drop privileges, and
that get a bit fiddly.)
Then I happened upon the TTYPath setting, which does exactly what I need;
and of course it combines perfectly fine with settings for User= or
WorkingDirectory. I ended up with the following:
[Unit]
Description=Interactive script started on boot

[Install]
WantedBy=multi-user.target

[Service]
# The magic to have prompts displayed to the user
TTYPath=/dev/tty1
StandardInput=tty
StandardOutput=tty

User=someuser
WorkingDirectory=/opt/software/
ExecStart=/opt/software/bin/start_soft

# Always restart on exit, disable restart counter, delay a little bit
# the restart to avoid spam in case of repeating error
Restart=always
StartLimitIntervalSec=0
RestartSec=5s
It only occured to me to have a look at how getty.service is configured, and
indeed it uses the same options:
StandardInput=tty
StandardOutput=tty
TTYPath=/dev/%I
TTYReset=yes          # reset $TTYPath before and after execution
TTYVHangup=yes        # disconnect all clients which have open $TTYPath
TTYVTDisallocate=yes  # deallocate before and after execution; this ensures screen and scrollback buffer is clear
A inconvenience is that if you start on tty1, then messages from systemd or
the kernel get mixed up with your program output. If you start on tty2, I
tried to add ExecStartPre=chvt 2, but the VT would switch back to tty1
depending on exact boot order.
Tableaux de jeux de caractères
Écrit le lundi 21 octobre 2024, modifié le dimanche 27 octobre 2024.
Par exercise (pour apprendre un peu de JavaScript), et un petit peu par utilité (devant résoudre des ambiguités autour de l'encodage de données au travail), j'ai créé une page pour explorer quelques jeux de charactères.
Importing a file as module
Écrit le vendredi 27 septembre 2024.
I want to import a file (maybe generated at run-time, maybe even the
name only known at run-time) that does not exist in sys.path. In a
couple of previous jobs that has happened with Python bindings
generated from protocol descriptions. In the past I've done that by
temporarily adding the parent to sys.path then running
importlib.import_module, while being annoyed there is no function
import_file(name: str, file_path: Path) -> ModuleType. It turns out
that importlib.util has all the bits necessary, it's just a matter of
putting them together:
import importlib.util
import os
import sys
from types import ModuleType

def import_file(module_name: str, file_path: os.PathLike) -> ModuleType:
    spec = importlib.util.spec_from_file_location(module_name, file_path)
    # spec: ModuleSpec(name='bar', loader=<_frozen_importlib_external.SourceFileLoader object at 0x7f30b1d10310>, origin='/tmp/tmp.WpcbUEkm32/foo.py')
    # if spec_from_file_location fails, it returns None rather than raise an exception
    if spec is None:
        raise ModuleNotFoundError(f"Can't import {module_name} from {file_path}")
    if spec.loader is None:
        raise ModuleNotFoundError(f"Can't import {module_name} from {file_path}")
    module = importlib.util.module_from_spec(spec)
    sys.modules[module_name] = module
    spec.loader.exec_module(module)
    return module
I suppose it is optional to add the module to sys.modules. If we do,
that will allow future import module_name to find the same module
(which might even be useful for the purpose of injecting different
code into a 3rd party library…). If we don't, then we get a new copy
of the module every time we import it again. Eg. if
/tmp/tmp.WpcbUEkm32/foo.py defined a global:
MODULE_GOBAL = 1

def myname():
    return __name__
And I try to imort it twice under the same name, same path, the module globals are disconnected:
foo1 = import_file("foo", "/tmp/tmp.WpcbUEkm32/foo.py")
foo2 = import_file("foo", "/tmp/tmp.WpcbUEkm32/foo.py")

foo1.myname()
# 'foo'
foo2.myname()
# 'foo'

foo1.MODULE_GOBAL += 1
print(foo1.MODULE_GOBAL)
# 2, as expected
print(foo2.MODULE_GOBAL)
# 1, unmodified
Handling binary documents having ASCII-compatible markup
Écrit le vendredi 9 août 2024, modifié le lundi 21 octobre 2024.
Python3 has bytes, which are sequences of 8-bit integers, and str,
sequences of Unicode code-points. To go from one to the other, you need to
encode or decode by giving an explicit encoding. There are many protocols
where the markup is ASCII, even if the data is some other encoding that you
don't know. If you know that other encoding is ASCII-compatible, it is useful
to be able to parse, split etc. the markup, and you just need to pass-through
the payload.
An initial search on the Internet brought up an article by Eric S. Raymond
that touches on that, and suggests to decode the data as ISO-8859-1, handle it
as str, then the payload can be losslessly recovered by reencoding it. The
first 256 codepoints of Unicode are exactly the ISO-8859-1 codepoints (a bit
more on that further down). As a result, the following is idempotent:
>>> by = bytes(range(0xff))
>>> by2 = bytes(str(by, encoding="iso-8859-1"), encoding="iso-8859-1")
>>> by == by2
True
A few days later I came across that article by Alyssa Coghlan, which mentions
the same idea, and also the existence of the errors="surrogateencoding" (PEP
383) error handler (also: codecs in the Python documentation), which is
designed to allow exactly what I needed:
>>> by = bytes(range(0xff))
>>> by2 = bytes(str(by, encoding="ascii", errors="surrogateescape"), encoding="ascii", errors="surrogateescape")
>>> by == by2
True
Alyssa Coghlan has some discussion about the merits of each approach, I can't
really say that functionally they have any meaningful difference. As she
points out, if you do anything but re-encode the non-ASCII compatible parts
using the same codec, you risk getting Mobijake (or if you're lucky, a
UnicodeDecodeError rather than silently producing garbage).
Performance-wise, let's see:
>>> import timeit
>>> timeit.timeit("""bytes(str(by, encoding="ISO-8859-1"), encoding="ISO-8859-1")""", setup="import random; by = random.randbytes(10_000)")
0.8885893229962676
>>> timeit.timeit("""bytes(str(by, encoding="ascii", errors="surrogateescape"), encoding="ascii", errors="surrogateescape")""", setup="import random; by = random.randbytes(10_000)")
125.00223343299876
That's… a very large difference. ESR's article points out that ISO-8859-1 has some properties that make it some efficient (it maps bytes 0x80—0xff to Unicode code-points of the same numeric value, so there is no translation cost, and the in-memory representation is more efficient). Trying increasing sizes:
>>> for size in 10, 100, 1_000, 2_000, 5_000, 10_000, 20_000:
...     by = random.randbytes(size)
...     duration = timeit.timeit("""bytes(str(by, encoding="ascii", errors="surrogateescape"), encoding="ascii", errors="surrogateescape")""", globals={"by": by}, number=100_000)
...     print(f"{size}\t{duration}")
...
10	0.0650910490003298
100	0.1047916579991579
1000	0.5472217770002317
2000	1.5103355319952243
5000	5.779067411000142
10000	12.497241530996689
20000	25.78209423399676
That seems to grow faster than O(n); the duration seems to be ×3 when the size goes ×2, is it growing like O(n1.5)?
In contrast, using the ISO-8859-1 method seems to having a complexity O(n):
>>> for size in 10, 100, 1_000, 2_000, 5_000, 10_000, 20_000, 50_000, 100_000:
...     by = random.randbytes(size)
...     duration = timeit.timeit("""bytes(str(by, encoding="iso-8859-1"), encoding="iso-8859-1")""", globals={"by": by}, number=100_000)
...     print(f"{size}\t{duration}")
...
10	0.05453772499458864
100	0.037617702000716235
1000	0.05454556500626495
2000	0.05654650100041181
5000	0.06352802200126462
10000	0.0898260960020707
20000	0.23981017799815163
50000	0.4997737009980483
100000	0.9646763860000647
By design of Unicode, the first 256 codepoints are the same as those of ISO 8859-1, and the conversion between Unicode and ISO 8859-1 is implemented in C in CPython. That's why the technique describes above works losslessly, and is so much faster than any mapping to surrogate escapes (even if I still don't understand how that latter approach is so slow).
I recently learned (between $WORK making me investigate character encoding
issues, and making a character table explorer as a JavaScript learning
exercise) about the C1 controls characters. Wikipedia has a write-up, in short
in 1973, during their work on 8-bit encodings for languages beyond English,
ECMA and ISO came up with an extra series of control characters in the
0x80--0x9F range, which would allow things like terminal control (the
0x9B Control Sequence Introducer for ANSI escape sequences), switching to a
different encoding (eg. SS2/SS2, used by EUC-JP), etc. However, it would still
be necessary to represent those in a 7-bit enviroment; so each of those could
also be written as 0x1B ␛ followed by an ASCII char (eg. Control Sequence Introducer
could be spelled 0x1B [). Both of the following print HI in reverse video with
xfce4-terminal and libvte-2.91 v0.70.6, but the second example doesn't work
in XTerm version 379. I guess XTerm doesn't (or dropped) support for the C1
controls spelling of the ANSI escape sequences.
$ printf "\\u001b[7m HI \\u001b[m Normal\n"
HI  Normal
$ printf "\\u009B7m HI \\u009Bm Normal\n"
HI  Normal
Anyway, those C1 controls were almost never used, but are reserved in the ISO 8859-X encodings. Windows-1252, presumably noticing that lack of use, assigned printable glyphs at those positions. HTML5 aliases ISO 8859-1 to Windows-1252, I guess because it wouldn't make sense to use control charactes in an HTML document, so it those appear, that must be because the author actually meant Windows-1252 (and if they don't, then ISO 8859-1 and Windows-1252 are identical outside the range of C1 controls.
TIL: set -u in bash
Écrit le lundi 1 avril 2024.
Trying a new Today I learned section… Today, I learned about set -u,
which will fail a bash script if we try to use a variable that's not defined.
No more deleting someone's files because a variable was not defined. Demo:
#!/bin/bash
set -u

GREETING=Hello

#oups I misspelt that
echo ${GREETINGS} world
If you run this:
$ ./script
./script: line 7: GREETINGS: unbound variable
That makes testing whether a variable is set slightly more complicated:
set -u
if [[ -z ${GREETINGS} ]]; then
    # oups we never get here, the previous line fails with "unbound variable"
    GREETINGS=$( ....compute greetings ...)
fi
Instead:
set -u
if [[ ! -v GREETINGS ]]; then
    GREETINGS=$( ... compute greetings ... )
fi
Where -v is a Bash Conditional Expression described thusly:
- -v varname
- True if the shell variable varname is set (has been assigned a value).
I suppose the actually equivalent test would be:
\[\[ ! -v GREETINGS ]] || \[\[ -z ${GREETINGS} ]],
to check whether the variable is not only set but also non-null.
I've always used set -e and set -o pipefail in shell scripts. The first
will exit the entire script if any command (more specifically: any pipeline
fails). However by default, quoting the manual: the "exit status of a pipeline
is the exit status of the last command in the pipeline", meaning the following
succeeds:
$ false | true
$ echo $?
0
But, if "pipefail is enabled, the pipeline's return status is the value of
the last (rightmost) command to exit with a non-zero status, or zero if all
commands exit successfully", so:
$ set -o pipefail
$ false | true
$ echo $?
1
TL;DR: Use set -euo pipefail at the top of your bash scripts. Julia Evans
agrees.
Type stubs for RPi.GPIO
Écrit le samedi 30 mars 2024.
RPi.GPIO is a Python module for controlling GPIO pins on Raspberry Pi. It is old and little maintained (they still use sourceforge.net!), but still useful today. It doesn't have type hints, so I added stubs for RPi.GPIO, now available on PyPI.
Incidentally I learned of distribution name normalisation. Package names can
use ASCII letters, numbers, and ., - and _; but the normalised name is
lower-cased with any run of punctuation characters replaced with a single
dash, so rpi-gpio is the normal form for RPi.GPIO. pip the CLI tool and the
PyPI web interface accept any form: pip install RPi.GPIO, or pip install
rpi-gpio, or pip install rPi__GpIo will install the same package.
pip-compile with use the normalized name when writing a constraints file.
Tunnels IPv6 pour la maison
Écrit le samedi 15 décembre 2012.
J'ai voulu avoir de l'IPv6 à la maison. Mon opérateur Internet ne fournit que de l'IPv4, il faut donc tunneller d'une façon ou d'une autre. J'ai une Kimsufi à disposition, avec un accès IPv6 natif, j'ai donc voulu l'utiliser comme point de sortie.
Bien sûr, une solution est d'utiliser un fournisseur de tunnel comme HE ou SixXS, mais où est l'intérêt de ne pas faire les choses soi-même ?
Creusage de tunnels
Beaucoup de technologies qui permettent de faire des tunnels IPv6 à travers un réseau IPv4 :
| Nom | Type | Usage |
|---|---|---|
| 6in4 | Routeur - Routeur | Un lien IPv6 (typiquement entre routeurs) explicitement configuré entre les deux extrémités |
| GRE | Routeur - Routeur | Une technique d'encapsulation générique Cisco (depuis normalisée) avec quelques fonctionnalités en plus |
| 6to4 | Routeur - Internet | Un lien IPv6, les adresses sont dans 2002::⁄32 et on inclut dans l'adresse IPv6 l'adresse IPv4 (publique !) du routeur. Il y a besoin de relais sur l'Internet (pour le sens Internet -> Routeur) |
| ISATAP | Hôte - Hôte | Deux hôtes (éventuellement routeurs pour leurs réseaux respectifs) qui peuvent se parler en IPv4, avec quelques options d'autoconfiguration. Prévu pour un réseau local. |
| 6over4 | Hôte - Hôte | Comme ISATAP, mais les hôtes doivent se parler en IPv4 multicast (typiquement, ils sont sur le même LAN). Pas intéressant par rapport à ISATAP, mais historiquement le premier. |
| Teredo | Hôte - Internet | Un hôte (éventuellement derrière un NAT) qui accède à l'Internetv6 |
| IPsec | Routeur - Routeur | Initialement prévu pour créer un tunnel sécurisé entre deux réseaux |
Quand on a un point de sortie, la technique idéale est 6in4, ou éventuellement IPsec en mode authentification (le chiffrement est peu intéressant, puisque couvrant uniquement la partie du trafic de la maison au point de sortie, et uniquement pour l'IPv6…).
Plan du réseau
Le serveur / point de sortie utilise lui-même des adresses IPv6. Le réseau côté maison a besoin d'au moins deux préfixes, pour le Wifi et pour le filaire. Or, OVH ne fournit aux kimsufi qu'un seul /64… Il va donc falloir découper en plusieurs morceaux. J'ai choisi /80, attribué comme suit :
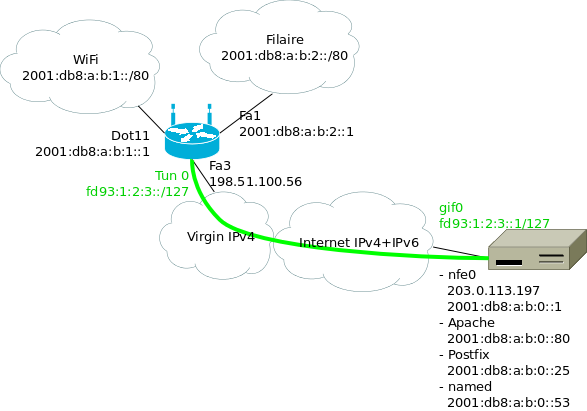
Où :
- 2001:db8:a:b::/64 est le préfixe attribué au point de sortie ;
- le premier /80 est attribué aux différents services qui tournent sur la machine ;
- les /80 suivants pour la maison ;
- en vert le tunnel entre le routeur Wifi à la maison et le point de sortie ;
J'ai utilisé des adresses ULA pour les extrémités du tunnels, mais en
fait il n'y en a pas vraiment besoin : une fois qu'on a commencé à
découper notre /64, autant aller jusqu'au bout. Ça permet juste de
bien reconnaître les adresses dans les fichiers de configuration et
dans les tcpdump.
Problèmes
Il y a deux problèmes avec cette façon de faire. Le premier est évident : on utilise des préfixes qui font plus que /64. Cela nous fait essentiellement perdre les mécanismes d'auto-configuration sur les réseaux de la maison.
Le deuxième est un peu plus subtile. Le /64 fournit par OVH n'est pas vraiment routé jusqu'à nous. Si c'était le cas, tous les paquets à destination du /64 seraient livrés à 2001:db8:a:b::1 (par exemple), et notre routage interne avec les /80 lui serait transparent. À la place, le dernier routeur s'attend à être directement connecté à ce /64, et à pouvoir faire directement un NS et recevoir une réponse pour chaque adresse. Il va donc falloir mettre en place sur l'interface externe un proxy NDP, qui fera croire au routeur que toutes les adresses sont directement connectées.
Implémentation
- Routage sur le point de sortie
On va configurer les adresses que l'on utilise sur la machine comme des /128 (ou éventuellement comme des /80, enfin bref), créer le tunnel, et ajouter les routes statiques vers la maison.
Quelques lignes dans
rc.conf:ifconfig_nfe0="inet 203.0.113.197/24" defaultrouter="203.0.113.254" ifconfig_nfe0_ipv6="inet6 auto_linklocal" # entree statique pour le routeur : # http://travaux.ovh.net/?do=details&id=6819 #rtsold_enable="YES" ipv6_defaultrouter="fe80::5:73ff:fea0:0%nfe0" ifconfig_nfe0_alias0="inet6 2001:db8:a:b::1/128" ifconfig_nfe0_alias1="inet6 2001:db8:a:b::22/128" ifconfig_nfe0_alias2="inet6 2001:db8:a:b::25/128" ifconfig_nfe0_alias3="inet6 2001:db8:a:b::80/128" # tunnel vers la maison gif_interfaces="gif0" gifconfig_gif0="203.0.113.197 198.51.100.56" ifconfig_gif0="mtu 1480" ifconfig_gif0_ipv6="inet6 -auto_linklocal" ifconfig_gif0_alias0="fd93:1:2:3::1/127" ipv6_gateway_enable="YES" ipv6_static_routes="home_wifi home_wired" ipv6_route_home_wifi="2001:db8:a:b:1:: -prefixlen 80 fd93:1:2:3::" ipv6_route_home_wired="2001:db8:a:b:2:: -prefixlen 80 fd93:1:2:3::"
Si pf(4) tourne, on ajoutera :
table <home_nets>  const persist { 2001:db8:a:b:1::/80 2001:db8:a:b:2::/80 }
extif = "nfe0"
tunif = "gif0"
# Tunnel 6in4 vers maison
pass on $extif proto ipv6
pass from <home_nets> to any
pass from any to <home_nets>

# Éventuellement des règles plus restrictives pour contrôler ce qui
# arrive à la maison
- Configuration du routeur wifi
Le routeur est un Cisco 877W qui fait tourner 15.1(3)T4. En 12.2, j'ai vu que parfois, le routeur décide de ne pas répondre aux NS, ce qui est un peu gênant. On utilise DHCPv6 pour distribuer les adresses. L'interface Wi-Fi ne peut pas être configurée en IPv6, mais on peut la placer dans un bridge qui, lui, peut être configuré avec IPv6.
ipv6 unicast-routing
ipv6 cef
!
interface Dot11Radio0
 description wireless
 bridge-group 1
 ssid Coloc
!
interface BVI 1
 description bridge pour wireless
 ipv6 mtu 1480
 ipv6 address 2001:DB8:A:B:1::1/80
 ipv6 nd autoconfig default-route
 ipv6 nd managed-config-flag
 ipv6 dhcp server HOME_WLANv6
!
interface Vlan20
 description vlan wired
 ipv6 mtu 1480
 ipv6 address 2001:DB8:A:B:2::1/80
 ipv6 nd managed-config-flag
 ipv6 dhcp server HOME_WIREDv6
!
interface range FastEthernet 0 - 2
 switchport mode access
 switchport access vlan 20
 description wired (vlan 20)
 spanning-tree portfast
!
interface Vlan10
 description vlan internet
 ip address dhcp
!
interface FastEthernet3
 description internet (vlan 10)
 switchport access vlan 10
!
interface Tunnel0
 description tunnel vers serveur
 no ip address
 ipv6 address FD93:1:2:3::/127
 tunnel source Vlan10
 tunnel destination 203.0.113.197
 tunnel mode ipv6ip
!
ipv6 dhcp pool HOME_WIREDv6
 address prefix 2001:DB8:A:B:2::/80
 dns-server 2001:DB8:A:B::53
!
ipv6 dhcp pool HOME_WLANv6
 address prefix 2001:DB8:A:B:1::/80
 dns-server 2001:DB8:A:B::53
!
ipv6 route ::/0 FD93:1:2:3::1/127
Les interfaces Fa 0 - 2, utilisées pour le LAN filaire, sont mises en
portfast. Sans leportfast, il faut ≈45 secondes à STP pour accepter que je n'ai pas créé de boucle en branchant mon portable. NetworkManager envoie n RS avec un timeout de t secondes pour la réponse RA. Avec n = 3, t = 1 seconde (RFC2461), NetworkManager a le temps d'abandonner plusieurs fois… Donc on passe enportfast. - Proxy NDP
Comme mentionné plus haut, l'un des soucis est que le routeur devant la KS s'attend à voir le /64 complètement à plat. Il faut donc un proxy NDP qui réponde à la place des machines qui sont à la maison.
Ça fait environ 300 lignes pour un programme qui écoute avec
libpcaples NS sur l'interface externe et qui envoie les NA correspondants. Le code est dans un dépôt git (ou interface gitweb). Avec le réseau montré plus haut, j'appellendp6avec les options :ndp6 -i nfe0 -p 2001:db8:a:b:1::/80 -p 2001:db8:a:b:2::/80
Les gens qui utilisent Linux sur le point de sortie seront intéressés par ndppd. Parmi les linuxeries, il y a la lecture de
/proc/net/ipv6_routepour mettre à jour les réseaux proxifiés, l'utilisation d'unesocketAF_PACKETpour écouter les paquets qui ne nous sont pas destinés.
Soucis rencontrés
- Clients DHCP
Avec ISC dhclient, lorsqu'une adresse est configurée par DHCPv6, elle est installée avec un préfixe en /64. C'est un bug dans le client DHCP (les annonces DHCP ne contiennent qu'une adresse, pas d'informations sur le lien local). La RFC 5942, section 5 explique le problème, disant que c'est ce qui arrive quand « the IPv6 subnet model is not understood by the implementers of several popular host operating systems ».
Le bug Debian #684009 contient un patch pour ISC dhclient (apparemment remonté upstream). De son côté, Network Manager ne fait ples confiance aux préfixes annoncé par les clients DHCPv6.
Le client WIDE dhcp6c a le bon comportement (à condition de lui dire de demander une adresse…), je n'ai pas testé son intégration avec Network Manager.
Le Windows 7 du boulot semble avoir le bon comportement.
- Bizarrerie sur le DHCP côte WAN
Les serveurs DHCP de chez Virgin Media se comportent bizarrement. En particulier, après une coupure de courant, le routeur ne reçoit pas d'adresse jusqu'à ce que le modem câble se fasse rebooter. Pas quelque chose que je peux corriger de mon côté…
ZFS pour des mises à jour sereines
Écrit le samedi 2 juin 2012, modifié le lundi 11 mars 2024.
Avec FreeBSD 9.0 qui est sorti il y a presque six mois, il est grand temps de se mettre à jour. On ne peut pas à la fois prétendre au status de cyborg, et utiliser autre chose que la dernière version de son OS préféré !
Dans un épisode précédent on avait installé son serveur avec ZFS, justement pour pouvoir faire des mises à jour avec une solution de repli si les choses tournent mal. On a deux solutions : faire un snapshot puis mettre à jour, avec la possibilité de faire un rollback plus tard ; ou alors installer dans un nouveau volume et pointer le bootloader sur le nouvel environnement. J'ai exploré la deuxième option. Cette deuxième option permet de ne pas tout perdre s'il faut revenir en arrière. On verra dans la suite si cela devait se révéler utile…
Préparation
Histoire d'avoir les ports déjà construits, on installe poudriere, la configuration se résume à pointer sur un FTP proche de chez nous. Ensuite on prépare un environnement pour 9.0 :
poudriere jail  -c -v 9.0-RELEASE -a amd64 -j poudre90
poudriere ports -c
On récupère la liste des ports installés, et tant qu'on y est on récupère aussi leur configuration pour que poudriere reconstruise les ports avec les bonnes options.
(pkg_version -o; jexecall pkg_version -o) >portlist
sort <portlist| uniq >portlistuniq
cut -d' ' -f1 <portlistuniq >portlist
cp -r /srv/jails/*/var/db/ports/* /usr/local/etc/poudriere.d/options
poudriere bulk -f portlist
Le système de base
Pendant que poudriere mouline, on installe FreeBSD 9.0 sur un système de fichiers à part.
zfs create zroot/slash90
zfs set mountpoint=/slash90 zroot/slash90
zfs create zroot/slash90/usr

cd /slash90
fetch http://ftp.fr.freebsd.org/pub/FreeBSD/releases/amd64/amd64/9.0-RELEASE/{base,kernel,src}.txz
tar -xpf base.txz
tar -xpf kernel.txz
tar -xpf src.txz
Pour les fichiers de configuration, on va copier la configuration
depuis notre environnement actuel vers l'installation toute fraîche,
puis lancer un coup de mergemaster(8) :
cd /slash90/etc
cp -a /etc/ .
chroot /slash90
mergaster -FUvi
On profite également d'être dans un chroot dans /slash90 pour
installer les ports qu'on vient de construire.
La configuration réseau a un peu changé. Une configuration avec plusieurs addresses dans chaque famille ressemble à :
ifconfig_nfe0="inet 203.0.113.13/24"
defaultrouter="203.0.113.254"
ifconfig_nfe0_ipv6="inet6 2001:db8:1:8248::1/64 accept_rtadv"
rtsold_enable="YES" # ou ipv6_defaultrouter="fe80::f00:baa%nfe0"

ifconfig_nfe0_alias0="inet  198.51.100.43/32"
ifconfig_nfe0_alias1="inet6 2001:db8:1:8248::25"
ifconfig_nfe0_alias2="inet6 2001:db8:1:8248::53"
ipv6_network_interfaces n'est plus nécessaire.
On copie également /usr/local/etc dans /slash90.
Bascule vers 9.0
Pour basculer d'un environnement vers l'autre, il suffit1 de faire :
zfs set canmount=noauto zroot/slash82
zfs set canmount=noauto zroot/slash82/usr

vi /slash90/boot/loader.conf
# Ajouter : zfs_load="YES"
# et : vfs.root.mountfrom="zfs:zroot/slash90"
zfs unmount zroot/slash90
zfs unmount zroot/slash90/usr
zfs set mountpoint=/ zroot/slash90
zfs set mountpoint=/usr zroot/slash90/usr
zpool set bootfs=zroot/slash90 zroot
Dans mon cas, l'environnement actuel est installé dans
zroot/slash82, avec /usr qui est dans zroot/slash82/usr. Si la
racine du système est directement à la racine du pool ZFS, il y aura
quelques subtilités, si on passe zroot en noauto il faudra penser
à modifier les autres points de montage par exemple. De plus, chez moi
/var est dans zroot/var, monté automatiquement par ZFS, donc il
n'y a pas besoin de le déplacer.
Au premier essai, ma kimsufi n'a pas démarré. Un peu d'investigation
via le le mode rescue-pro d'OVH (un simple netboot avec les
disques accessibles) ne donne rien. Un zpool import -o altroot=/mnt
plus tard, on refait la bascule dans l'autre sens (en utilisant
zroot/slash82), et on retrouve une machine qui boote.
Le lendemain, je retente l'opération, cette fois en vKVM (une machine virtuelle qui démarre sur le disque dur du serveur), et là… le démarrage se passe correctement. Je ne sais pas pourquoi au premier essai, les choses se sont bloquées au boot.
Après un peu d'exploration, on voit qu'il y a certaines choses qui ont été « perdues » :
- ce qui est dans
/root(un script de sauvegarde, par exemple) ; - ce qui est dans
/usr/local. J'ai pensé auxportset à leur configuration, mais j'ai laissé de côté le RTM d'OVH, les dossiers de données depoudriere… ; /home(qui ne contenait guère que~fred/.ssh/authorized_keysd'intéressant).
Il suffit de monter zroot/slash82 (qui est actuellement en
canmount=noauto) pour avoir accès à ses données et les réinstaller.
Les jails
On pourrait tout à fait adopter la même procédure : installer dans un système de fichiers à part, y compris les ports, rapatrier les configurations, et pointer ezjail vers la nouvelle installation. La mise à jour en place semble plus simple, et tellement moins risquée que pour la machine hôte…
ezjail-admin update -s 8.2-RELEASE -U
Attention, freebsd-update essaie de mettre à jour le noyau, il faut
le relancer à la main une deuxième fois.
Malheureusement, il faut lancer à la main mergemaster pour chacune
des jails (et tant qu'on y pense, mettre à jour le gabarit
d'ezjail).
Pour les ports, grâce à la préparation faite plus haut, on a déjà des
packages binaires à jour pour nos jails, et il suffit de lancer un
jexecall portmaster -a pour tout mettre à jour.
Conclusion
Le passage à 9.0 n'a pas été aussi facile qu'attendu. En particulier,
je ne sais pas pourquoi le premier démarrage n'a pas réussi du premier
coup, et si c'est dû à l'utilisation de ZFS ou pas. De plus, la
méthode que j'ai suivie n'était pas idéale —je suppose qu'en ayant de
vraies procédures de backup-restore, je n'aurais pas oublié RTM ou
les scripts qui traînent dans /root. D'un autre côté, le paramètre
bootfs plus jouer un peu avec les points de montage permet de
basculer facilement d'une installation à l'autre ; c'était une
promesse de ZFS, et cette promesse est tenue. Au premier essai, c'est
ce qui m'a permis de revenir sur une configuration fonctionnelle.
Je regrette de ne pas avoir adopté poudriere plus tôt.
Footnotes:
Il serait certainement possible de laisser /usr hériter de
zroot/slashXX, et ainsi il n'y aurait qu'un seul point de montage à
déplacer.